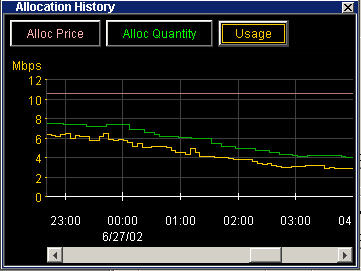
The Allocation History graph displays three types of history for the agent: measured traffic, allocation quantity received, and price paid:
At the top of the graph are three buttons.
Alloc Price: The price you have paid for bandwidth, in, for example, dollars-per-month per Mbps unit (the units are configurable). When you click this button, the Y-axis of the graph shows these units.
Alloc Quantity: The amount of bandwidth you have been allocated. When you click this button, the Y-axis of the graph scales to match this measurement.
Usage: The amount of your traffic that Merkato has measured. This measurement is used in Traffic-based and Quick Response bidding. When you click this button, the Y-axis of the graph scales to match this measurement.
The graph can be scaled to show greater or smaller time intervals. Inside the graph, right-click the mouse button. The time-scale choices appear:
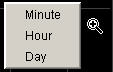

Select a time from the list. The graph’s scale changes.