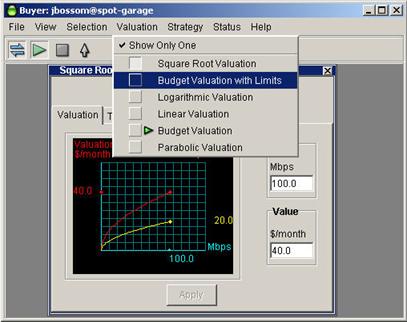
You choose a valuation from the Valuation pull-down menu. The first item in the menu, Show Only One, controls whether multiple valuation windows can be displayed. If a check mark appears before this control, only one valuation can appear on the desktop.
Each valuation has a Current radio button at the top of the window. Select the Current button to make a valuation active. (This automatically de-selects whichever valuation had been active.) The green arrow in the menu-bar pull-down list also indicates which valuation is active.
The graphs of valuations use different parameters to change their shapes and values, but all result in a representation of valuation and cost for a quantity of bandwidth. The graph to the left of the numerical entry boxes shows two curves; the red curve represents valuation relative to quantity and the green curve represents maximum cost relative to quantity. If there appears to be only one curve, both curves may be identical and overlapping.