To open Traffic screen click the Traffic link on the left of the Portal.
For a Seller agent, the Traffic page shows the combined amount of data all buyers have transferred through the Merkato network control point.
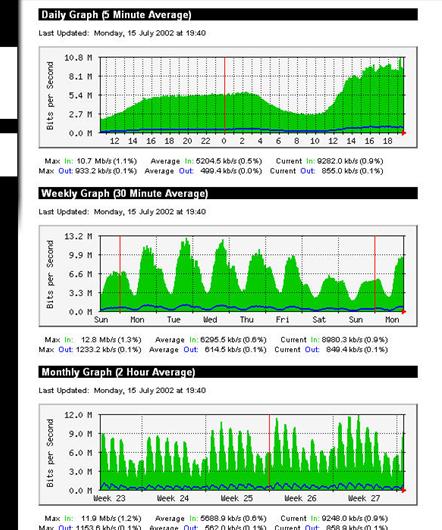
Three charts are provided to represent three time scales:
All three charts are based on five-minute sample intervals. Merkato gathers traffic statistics in both the input and output directions every five minutes. Each five-minute sample represents an average over that five-minute period. In other words, peaks lasting less than five minutes are not accurately represented in the charts. These five-minute samples are used directly in the daily chart. These values are then combined into longer averages for the weekly and monthly charts.
The green-shaded portion of the chart indicates traffic in the incoming direction. Traffic indicated by the blue line is in the outgoing direction.
Below each chart are three columns of figures indicating the maximum, average, and current values for the period displayed.