Auction Graph
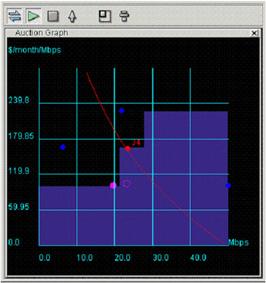
The Auction graph indicates the state of the Merkato auction
in progress. Dots indicate current bids. A Buyer agent displays a graph like
the one in the illustration.
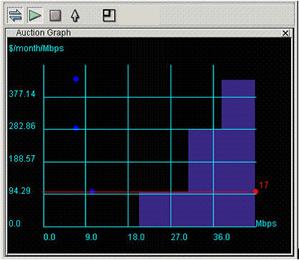
For Seller agents, the Auction graph displays fewer elements
because allocations are not being made to the seller agent. The display looks
like the one shown in the illustration.
The graph elements are:
- Y-axis, indicating unit price (the axis scales
automatically to show all current bids).
- X-axis, indicating quantity (the axis scales
automatically to show available quantity).
- Blue dots representing the last bids received from
all bidders (excluding a bid by the dynamic seller agent, which is shown
as a red dot).
- A red dot, with ID number, indicating the last bid
from the agent currently logged in.
- A red line, representing your agent's valuation
curve, as determined by settings in your active valuation window.
- A blue shaded area, representing the allocation of
bandwidth to successful bidders, except for any bandwidth allocated to
your agent. This area is a series of blocks, where the height represents
the unit price paid and the width represents the quantity allocated. (The
bandwidth allocated to your agent is the amount of blue under and to the
left of the red dot.)